The explanatory visualization framework: An active learning framework for teaching creative computing using explanatory visualizations
Abstract
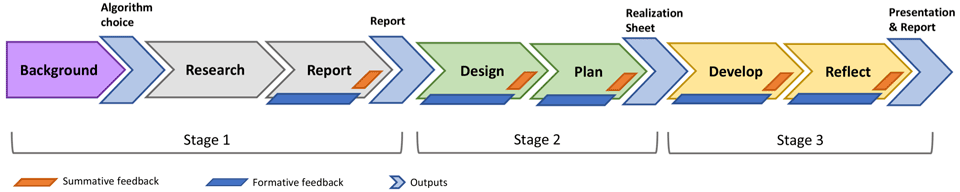
Visualizations are nowadays appearing in popular media and are used everyday in the workplace. This democratisation of visualization challenges educators to develop effective learning strategies, in order to train the next generation of creative visualization specialists. There is high demand for skilled individuals who can analyse a problem, consider alternative designs, develop new visualizations, and be creative and innovative. Our three-stage framework, leads the learner through a series of tasks, each designed to develop different skills necessary for coming up with creative, innovative, effective, and purposeful visualizations. For that, we get the learners to create an explanatory visualization of an algorithm of their choice. By making an algorithm choice, and by following an active-learning and project-based strategy, the learners take ownership of a particular visualization challenge. They become enthusiastic to develop good results and learn different creative skills on their learning journey.
J. C. Roberts, P. D. Ritsos, J. Jackson, and C. Headleand, “The explanatory visualization framework: An active learning framework for teaching creative computing using explanatory visualizations,” IEEE Transactions on Visualization and Computer Graphics, vol. 24, no. 1, pp. 791–801, Jan. 2018.
doi: 10.1109/TVCG.2017.2745878 Presented at IEEE VIS 2017
Bibtex
@article{Roberts-et-al-TVCG-2018,
  author = {Roberts, Jonathan C. and Ritsos, Panagiotis D. and Jackson, James and Headleand, Chris},
  journal = {IEEE Transactions on Visualization and Computer Graphics},
  title = {The explanatory visualization framework: {A}n active learning framework for teaching creative computing using explanatory visualizations},
  year = {2018},
  volume = {24},
  number = {1},
  pages = {791-801},
  month = jan,
  doi = {  10.1109/TVCG.2017.2745878}
}