Contextual Navigation
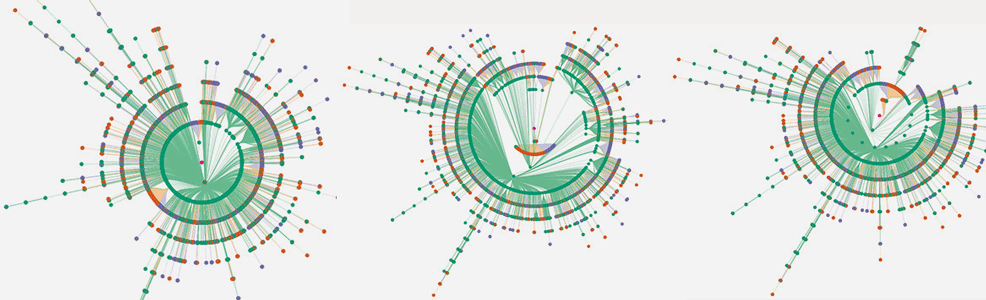
We explore the concept of Contextual Navigation through visual interfaces, for which we use circular, centred-phylogram projections of networks. We present the phylogram-based visualization as a proof-of-concept of a context-driven approach, using an imaginary police intervention scenario and a network security scenario.
Related Publications
C. C. Gray, P. D. Ritsos, and J. C. Roberts, “Contextual Network Navigation; Situational Awareness for Network Administrators,” in IEEE Symposium on Visualization for Cyber Security (VizSec), Chicago, IL, USA, 2015.
One of the goals of network administrators is to identify and block sources of attacks from a network steam. Various tools have been developed to help the administrator identify the IP or subnet to be blocked, however these tend to be non-visual. Having a good perception of the wider network can aid the administrator identify their origin, but while network maps of the Internet can be useful for such endeavors, they are difficult to construct, comprehend and even utilize in an attack, and are often referred to as being “hairballs”. We present a visualization technique that displays pathways back to the attacker; we include all potential routing paths with a best-efforts identification of the commercial relationships involved. These two techniques can potentially highlight common pathways and/or networks to allow faster, more complete resolution to the incident, as well as fragile or incomplete routing pathways to/from a network. They can help administrators re-profile their choice of IP transit suppliers to better serve a target audience.
[Abstract]
[Details]
[PDF]
[doi:10.1109/VIZSEC.2015.7312769]
C. C. Gray, J. C. Roberts, and P. D. Ritsos, “Where Can I Go From Here? Drawing Contextual Navigation Maps of the London Underground,” in Posters presented at the IEEE Conference on Visualization (IEEE VIS 2015), Chicago, IL, USA, 2015.
Network administrators often wish to ascertain where network attackers are located; therefore it would be useful to display the network map from the context of either the attacker’s potential location or the attacked host. As part of a bigger project we are investigating how to best visualize contextual network data. We use a dataset of station adjacencies with journey times as edge weights, to explore which visualization design is most suitable, and also ascertain the best network shortest-path metric. This short paper presents our initial findings, and a visualization for Contextual Navigation using circular, centered-phylogram projections of the network. Our visualizations are interactive allowing users to explore different scenarios and observe relative distances in the data.
[Abstract]
[Details]
[PDF]