Learning Analytics
Learning analytics (LA) refers to the measurement, collection, analysis and reporting of data about the progress of learners and the contexts in which learning takes place. In LA, we examine how analytics can be used to improve teaching, learning, student engagement and assessment processes. Current projects, lead by colleagues Cameron Gray and Dave Perkins, are exploring metrics for student pressure in higher education, analytics of attendance and engagement, and visualization-facilitated assessment and programme design. This theme also has strong synergies with Personal Learning Visualization (PLV). PLV is concerned with employing advanced visualization techniques, from the fields of Information Visualization and Visual Analytics, in order to facilitate the sense-making process, say for example for an individual’s learning performance. In the PLV theme learners become producers and consumers of the data, and are essentially immersed in a world of ubiquitous information that influences their learning process.
Related Publications
C. C. Gray, D. Perkins, and P. D. Ritsos, “Degree Pictures: Visualizing the university student journey,” Assessment & Evaluation in Higher Education, vol. 20, no. 4, pp. 568–578, Aug. 2020.
The field of learning analytics is progressing at a rapid rate. New tools, with ever-increasing number of features and a plethora of datasets that are increasingly utilized demonstrate the evolution and multifaceted nature of the field. In particular, the depth and scope of insight that can be gleaned from analysing related datasets can have a significant, and positive, effect in educational practices. We introduce the concept of degree pictures, a symbolic overview of students’ achievement. Degree pictures are small visualizations that depict graphically 16 categories of overall student achievement, over the duration of a higher education course. They offer a quick summary of students’ achievement and are intended to initiate appropriate responses, such as teaching and pastoral interventions. This can address the subjective nature of assessment, by providing a method for educators to calibrate their own marking practices by showing an overview of any cohort. We present a prototype implementation of degree pictures, which was evaluated within our School of Computer Science, with favourable results.
[Abstract]
[Details]
[PDF]
[doi:10.1080/02602938.2019.1676397]
D. Dave Perkins, C. C. Gray, P. D. R. Ritsos, and L. I. Kuncheva, “JISC/Bangor University Learning Analytics Project Summary & Case Study,” JISC, UK & Bangor University, Commissioned Report, 2020.
Insights into activities we undertake as educators and students have the potential to enhance learning and reduce unintentional consequences for all. Educators have for a long time used data to monitor students and grade them. More recently additional yet still traditional metrics have been added to the available tools in every day education. The latest generation of information are derived metrics with additional intelligence. This project has developed a Work Pressure metric than can be used by both educator and learner. The focus is on the assessments for a given programme and Work Pressure that this generates. Additionally, included is behavioural characteristics, these have the potential to have significant impact upon the individual student journey.
[Abstract]
[Details]
[PDF]
J. C. Roberts, C. Headleand, D. Perkins, and P. D. Ritsos, “Personal Visualisation for Learning,” in Personal Visualization: Exploring Data in Everyday Life Workshop, IEEE Conference on Visualization (VIS), Chicago, IL, USA, 2015.
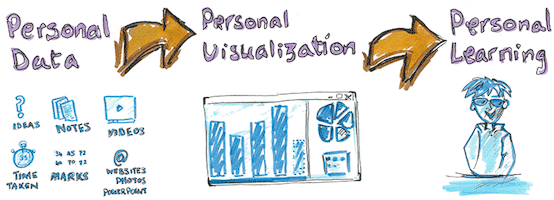
Learners have personal data, such as grades, feedback and statistics on how they fair or compare with the class. But, data focusing on their personal learning is lacking, as it does not get updated regularly (being updated at the end of a taught session) and the displayed information is generally a single grade. Consequently, it is difficult for students to use this information to adapt their behavior, and help them on their learning journey. Yet, there is a rich set of data that could be captured and help students learn better. What is required is dynamically, regularly updated personal data, that is displayed to students in a timely way. Such ‘personal data’ can be presented to the student through ‘personal visualizations’ that engender ‘personal learning’. In this paper we discuss our journey into developing learning systems and our resulting experience with learners. We present a vision, to integrate new technologies and visualization solutions, in order to encourage and develop personal learning that employs the visualization of personal learning data.
[Abstract]
[Details]
[PDF]
P. D. Ritsos and J. C. Roberts, “Towards more Visual Analytics in Learning Analytics,” in EuroVis Workshop on Visual Analytics (EuroVA), Swansea, UK, 2014, pp. 61–65.
Learning Analytics is the collection, management and analysis of students’ learning. It is used to enable teachers
to understand how their students are progressing and for learners to ascertain how well they are performing.
Often the data is displayed through dashboards. However, there is a huge opportunity to include more comprehensive
and interactive visualizations that provide visual depictions and analysis throughout the lifetime of the
learner, monitoring their progress from novices to experts. We therefore encourage researchers to take a comprehensive
approach and re-think how visual analytics can be applied to the learning environment, and develop more
interactive and exploratory interfaces for the learner and teacher.
[Abstract]
[Details]
[PDF]
J. C. Roberts, J. Jackson, C. Headleand, and P. D. Ritsos, “Creating Explanatory Visualizations of Algorithms for Active Learning,” in Posters presented at the IEEE Conference on Visualization (IEEE VIS 2016), Baltimore, MD, USA, 2016.
Visualizations have been used to explain algorithms to learners, in order to help them understand complex processes. These ‘explanatory visualizations’ can help learners understand computer algorithms and data-structures. But most are created by an educator and merely watched by the learner. In this paper, we explain how we get learners to plan and develop their own explanatory visualizations of algorithms. By actively developing their own visualizations learners gain a deeper insight of the algorithms that they are explaining. These depictions can also help other learners understand the algorithm.
[Abstract]
[Details]
[PDF]