The explanatory visualization framework - An active learning framework for teaching creative computing
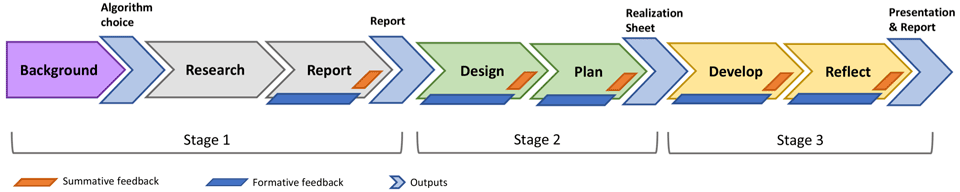
Visualizations are nowadays appearing in popular media and are used everyday in the workplace. This democratization of visualization challenges educators to develop effective learning strategies, in order to train the next generation of creative visualization specialists. There is high demand for skilled individuals who can analyze a problem, consider alternative designs, develop new visualizations, and be creative and innovative. Our three-stage framework, leads the learner through a series of tasks, each designed to develop different skills necessary for coming up with creative, innovative, effective, and purposeful visualizations. For that, we get the learners to create an explanatory visualization of an algorithm of their choice. By making an algorithm choice, and by following an active-learning and project-based strategy, the learners take ownership of a particular visualization challenge. They become enthusiastic to develop good results and learn different creative skills on their learning journey.
Related Publications
J. C. Roberts, P. D. Ritsos, J. Jackson, and C. Headleand, “The explanatory visualization framework: An active learning framework for teaching creative computing using explanatory visualizations,” IEEE Transactions on Visualization and Computer Graphics, vol. 24, no. 1, pp. 791–801, Jan. 2018.
Visualizations are nowadays appearing in popular media and are used everyday in the workplace. This democratisation of visualization challenges educators to develop effective learning strategies, in order to train the next generation of creative visualization specialists. There is high demand for skilled individuals who can analyse a problem, consider alternative designs, develop new visualizations, and be creative and innovative. Our three-stage framework, leads the learner through a series of tasks, each designed to develop different skills necessary for coming up with creative, innovative, effective, and purposeful visualizations. For that, we get the learners to create an explanatory visualization of an algorithm of their choice. By making an algorithm choice, and by following an active-learning and project-based strategy, the learners take ownership of a particular visualization challenge. They become enthusiastic to develop good results and learn different creative skills on their learning journey.
[Abstract]
[Details]
[PDF]
[doi: 10.1109/TVCG.2017.2745878]
[Presented at IEEE VIS 2017]
J. C. Roberts, P. D. Ritsos, and C. Headleand, “Experience and Guidance for the use of Sketching and low-fidelity Visualisation-design in teaching,” in Pedagogy of Data Visualization Workshop, IEEE Conference on Visualization (VIS), Phoenix, Arizona, USA, 2017.
We, like other educators, are keen to develop the next generation of visualisation designers. The use of sketching and low-fidelity designs are becoming popular methods to help developers and students consider many alternative ideas and plan what they should build. But especially within an education setting, there are often many issues that challenge students as they create low-fidelity prototypes. Students can be unwilling to contemplate alternatives, reluctant to use pens and paper, or sketch on paper, and inclined to code the first idea in their mind. In this paper we discuss these issues, and investigate strategies to help increase the breadth of low-fidelity designs, especially for developing data-visualisation tools. We draw together experiences and advice of how we have used the Five Design-Sheets method over eight years, for different assessment styles and across two institutions. This paper would be useful for anyone who wishes to use sketching in their teaching, or to improve their own experiences.
[Abstract]
[Details]
[PDF]
J. C. Roberts, J. Jackson, C. Headleand, and P. D. Ritsos, “Creating Explanatory Visualizations of Algorithms for Active Learning,” in Posters presented at the IEEE Conference on Visualization (IEEE VIS 2016), Baltimore, MD, USA, 2016.
Visualizations have been used to explain algorithms to learners, in order to help them understand complex processes. These ‘explanatory visualizations’ can help learners understand computer algorithms and data-structures. But most are created by an educator and merely watched by the learner. In this paper, we explain how we get learners to plan and develop their own explanatory visualizations of algorithms. By actively developing their own visualizations learners gain a deeper insight of the algorithms that they are explaining. These depictions can also help other learners understand the algorithm.
[Abstract]
[Details]
[PDF]